
The proliferation of streaming services has fundamentally reshaped how consumers access entertainment, transforming the traditional television and movie ecosystem into a fragmented digital marketplace. As platforms like Netflix, Amazon Prime Video, Apple TV+, HBO Max, Hulu, and a myriad of niche offerings continue to expand their libraries and subscriber bases, managing the associated costs has become a significant challenge for many. In response to this growing complexity, a new web application, the "Subscription Cost Visualizer," has emerged, aiming to provide consumers with a clear and concise overview of their streaming expenditures.
The Streaming Era: A Growing Financial Conundrum
The current media consumption landscape is undeniably dominated by streaming. This shift, which began in earnest in the late 2000s and accelerated rapidly throughout the 2010s, has seen a dramatic decline in physical media sales and a corresponding surge in subscription-based digital content. Services once considered novelties are now deeply embedded in the daily lives of millions, offering on-demand access to vast libraries of films, television series, documentaries, and original programming. This evolution, however, has not been without its financial implications.
The industry is characterized by constant flux. New services are launched, existing ones merge or rebrand, and crucially, subscription prices tend to increase periodically. This dynamic environment makes it increasingly difficult for consumers to accurately track their cumulative spending. The allure of exclusive content and the convenience of instant access often lead individuals to subscribe to multiple platforms, only to find themselves paying for services they use infrequently or have forgotten about entirely. This often leads to what is commonly referred to as "subscription creep" or "subscription fatigue," where the cumulative cost becomes a substantial, and often unexamined, monthly or annual expense.
Introducing the Subscription Cost Visualizer: A Tool for Financial Awareness
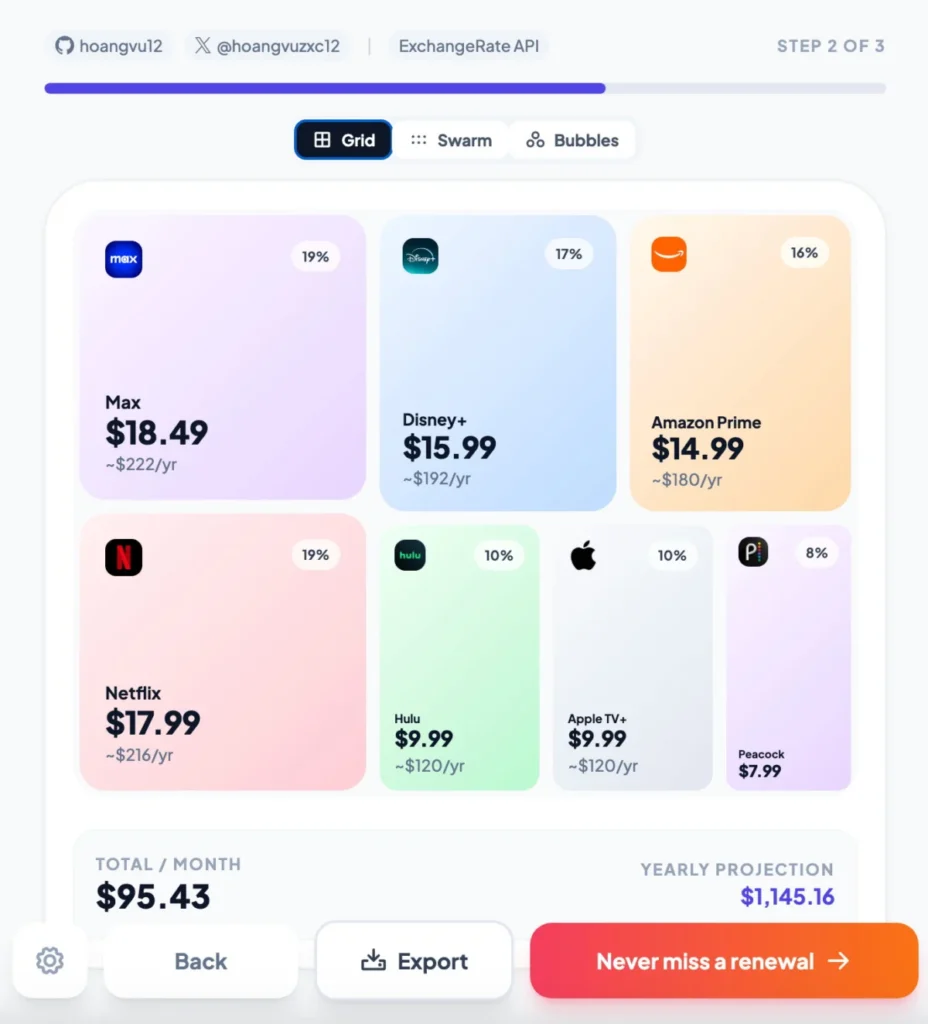
The "Subscription Cost Visualizer," accessible at visualize.nguyenvu.dev, is designed to address this very issue. This free web-based tool allows users to input information about their various streaming subscriptions, generating a visual representation or a straightforward list of their monthly and annual expenditures. The application aims to empower consumers by providing them with actionable data to understand where their entertainment budget is being allocated.
While the web tool is free to use, it is connected to a broader application called Vexly. Vexly is a subscription management service that offers more comprehensive features, including the ability to track costs, receive alerts before renewal dates, and gain deeper insights into spending habits. The creators of Vexly highlight the significant financial benefits of their service. One of the developers, who identified as the creator on a Hacker News forum, stated they built Vexly after realizing they were "wasting $200/month on forgotten subscriptions." This personal experience underscores the widespread nature of the problem, as the developer noted that "most people find 3-5 forgotten subscriptions in their first minute using Vexly." Further evidence of Vexly’s impact comes from its beta testers, who reportedly saved an average of $540 in their first year of using the application.
The Subscription Cost Visualizer, therefore, serves as an accessible entry point into this broader subscription management ecosystem. By offering a free, no-obligation tool, it allows individuals to quickly assess their current spending without the need to connect bank accounts or commit to a paid service. This low barrier to entry is crucial in encouraging widespread adoption and fostering greater financial awareness among a demographic heavily invested in digital entertainment.

Behind the Scenes: The Genesis of Vexly
The development of Vexly and its accompanying visualizer can be understood within the broader context of the evolving digital economy. As more services migrate to subscription models, from software and media to even physical goods, the need for effective personal finance management tools tailored to these recurring payments has become increasingly apparent. Traditional budgeting apps often focus on broader categories, and while they may track individual bills, they may not always highlight the specific impact of a multitude of small, recurring subscription fees.
The creator’s motivation, as articulated in online discussions, points to a common experience of unintentional overspending. The convenience of online sign-ups, often with free trials followed by automatic renewals, can lead to a gradual accumulation of forgotten charges. This is particularly true in the fast-paced world of streaming, where new services and exclusive content are constantly being introduced, prompting consumers to experiment with different platforms. The Vexly project appears to be a direct response to this observable consumer pain point, offering a practical solution to a problem that affects a large segment of the population.
Data and Functionality: How the Visualizer Works
The Subscription Cost Visualizer operates on a simple yet effective principle: user input. Individuals visit the website and manually enter details about each of their subscriptions. This typically includes the name of the service, the cost, and the billing frequency (monthly or annual). Once this information is compiled, the tool processes it to generate a clear visual chart or a detailed list. This output can highlight the total monthly cost, the total annual cost, and potentially break down spending by individual service.
The tool is designed to be versatile, accommodating both U.S. and European pricing structures and subscription services. This international scope reflects the global nature of the streaming industry and the widespread applicability of the subscription management problem. The underlying Vexly application offers additional features that enhance this functionality. These include:
- Automated Renewal Alerts: Users can receive timely notifications before a subscription is set to renew, providing an opportunity to cancel unwanted services.
- Bank Account Integration (Optional): For those who wish to automate the process further, Vexly may offer secure bank account linking to automatically detect and track subscription payments. However, the standalone visualizer tool explicitly states it functions "without connecting your bank," prioritizing user privacy and ease of access.
- Spending Analytics: Beyond simple cost tracking, the platform aims to provide deeper insights into spending patterns, helping users identify areas where they can potentially save money.
The emphasis on not requiring bank connections for the initial visualization tool is a significant point. It addresses potential user concerns about data privacy and security, making it more appealing to a broader audience who may be hesitant to link financial accounts to new applications.
Supporting Data and Industry Trends
The need for tools like the Subscription Cost Visualizer is further substantiated by broader industry trends and consumer behavior data. The global over-the-top (OTT) streaming market has experienced exponential growth. Projections from various market research firms consistently indicate a continued upward trajectory in subscriber numbers and revenue. For instance, Statista reported that the global revenue in the Streaming Services market is projected to reach US$223.00 billion in 2024. The number of users is expected to amount to 2.9 billion by 2027, with a significant portion of these users subscribing to multiple services.
This vast and growing market is fueled by a constant influx of new content and the competitive landscape among major players. Companies are investing billions in original programming to attract and retain subscribers. This creates a powerful incentive for consumers to explore various offerings, often leading to a complex web of subscriptions. A 2023 report by the Financial Times highlighted that the average American household subscribes to around 4-5 streaming services, with many admitting to paying for services they rarely use. This phenomenon, often termed "subscription fatigue," is a direct consequence of the ease of subscribing and the difficulty of unsubscribing or tracking cumulative costs.

The "Subscription Cost Visualizer" and its parent application, Vexly, are positioned to capitalize on this trend by offering a solution that directly addresses the financial anxieties associated with managing these numerous subscriptions. The appeal lies in its promise of clarity and control, empowering consumers to make informed decisions about their entertainment spending.
Broader Impact and Implications
The rise of tools like the Subscription Cost Visualizer has several broader implications for both consumers and the streaming industry itself.
For consumers, the primary benefit is increased financial literacy and control. By making the often-invisible costs of streaming services tangible, individuals can better manage their budgets, identify unnecessary expenses, and potentially reallocate funds towards other financial goals. This can lead to a more mindful approach to consumption, where entertainment choices are driven by genuine value rather than the inertia of auto-renewing subscriptions.
For the streaming industry, the existence and potential widespread adoption of such tools could indirectly influence consumer behavior. If a significant number of users begin actively tracking and questioning their subscription costs, it might incentivize service providers to:
- Re-evaluate Pricing Strategies: The constant increase in subscription fees could face greater scrutiny.
- Enhance Value Propositions: Platforms may need to focus more on delivering unique and compelling content to justify their costs.
- Improve Subscription Management Tools: Providers might be pressured to offer more user-friendly options for managing subscriptions directly within their platforms.
- Consider Bundling Options: The complexity of managing multiple subscriptions could lead to increased interest in more comprehensive and cost-effective bundles.
Furthermore, the success of Vexly and similar services could signal a growing demand for specialized personal finance management tools. As the digital economy becomes increasingly subscription-based, applications that help users navigate this landscape will likely see continued growth. This trend could inspire further innovation in areas such as automated expense tracking, personalized savings recommendations, and intelligent subscription cancellation services.
The Subscription Cost Visualizer, while a seemingly simple web tool, represents a significant step towards empowering consumers in the increasingly complex and costly world of streaming entertainment. It offers a much-needed dose of clarity, enabling individuals to take control of their digital subscriptions and ensure their entertainment spending aligns with their financial priorities. As the streaming era continues to evolve, tools that promote transparency and financial awareness will undoubtedly play an increasingly vital role.